
When traders trade the financial market using candlestick chart, Candlestick patterns are one of the most powerful tools in a trader’s arsenal. The Single candlestick or more, insights into market psychology, helping traders predict potential price movements and make informed decisions. Whether you’re a beginner or an experienced trader, understanding these patterns can significantly improve your trading strategy. In this blog, we’ll explore the top candlestick patterns that everyone should know and how they can be used effectively in trading.
Candlestick Patterns
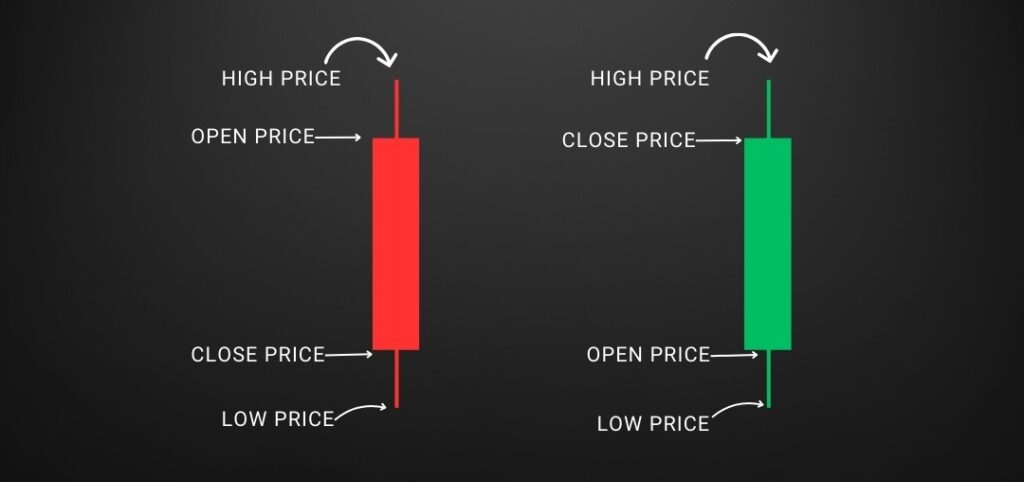
Candlestick charts originated in Japan in the 18th century and were used to analyze rice prices. Today, they are widely used in financial markets to represent price movements over a specific time period. Each candlestick consists of a body and wicks (or shadows), which show the open, close, high, and low prices.
Candlestick patterns are formed by one or more candlesticks and provide clues about market sentiment, whether buyers (bulls) or sellers (bears) are in control. Recognizing these patterns can help traders identify potential reversals, continuations, or indecision in the market.
Top Candlestick Patterns Every Trader Should Know
Here are the most important candlestick patterns that can help you make better trading decisions:
1. Doji
- What it looks like: A Doji has a small body with wicks on both sides, indicating that the opening and closing prices are nearly the same.

- What it means: A Doji represents indecision in the market. It suggests that neither bulls nor bears are in control, and a potential reversal or trend change could occur.
- How to trade it: Look for a Doji after a strong uptrend or downtrend. It could signal a reversal if confirmed by the next candle.
2. Hammer and Hanging Man
- What it looks like: Both patterns have a small body and a long lower wick. The Hammer appears during a downtrend, while the Hanging Man appears during an uptrend.
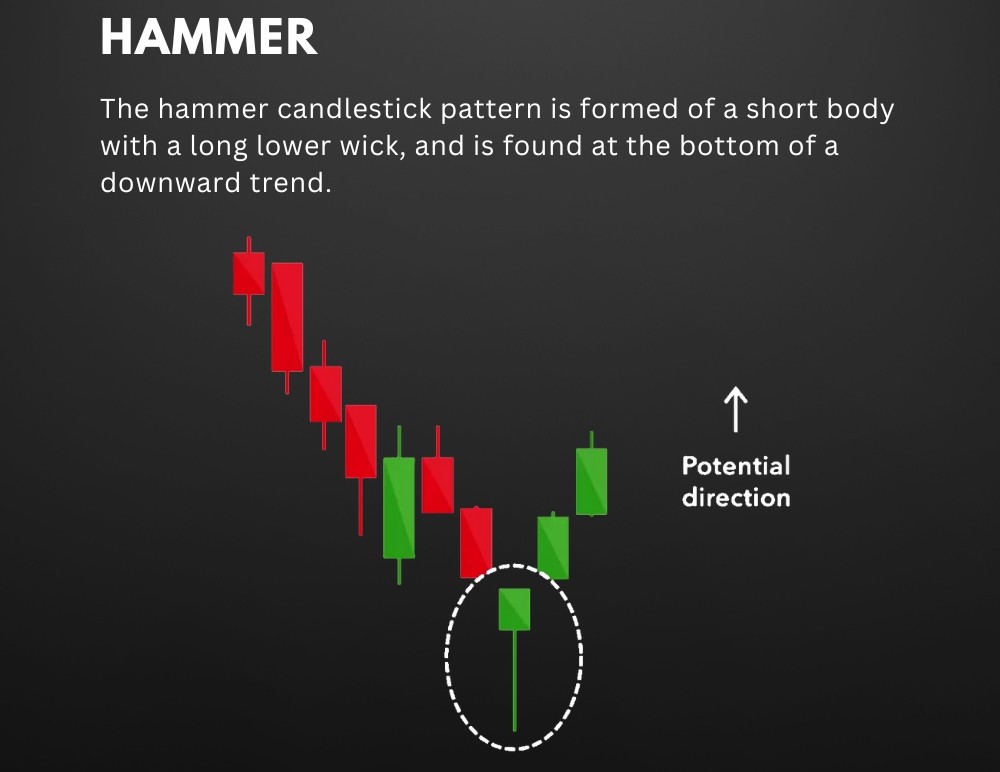
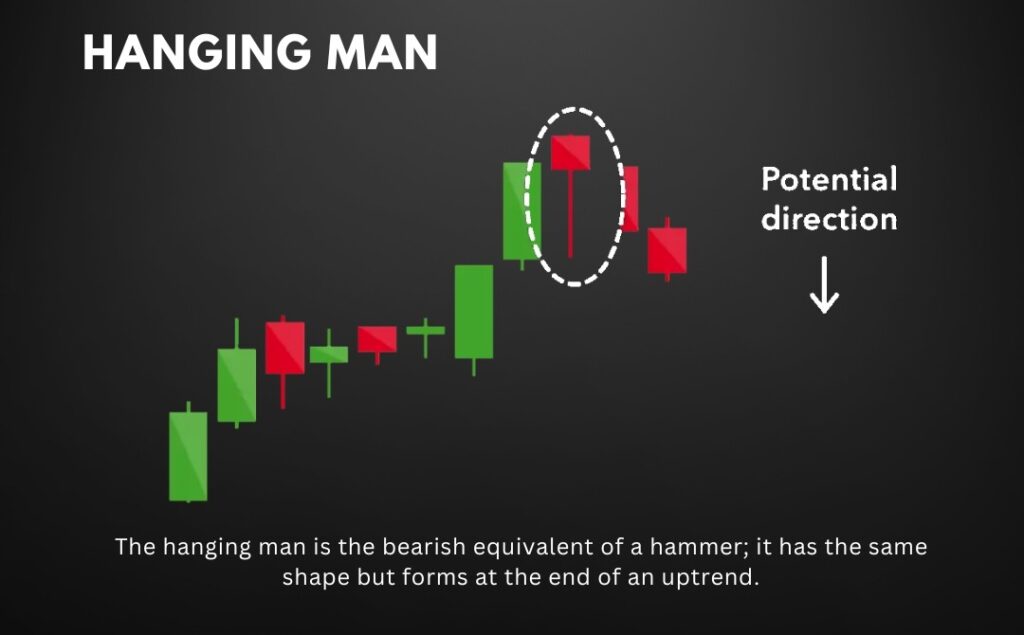
- What it means: A Hammer signals a potential bullish reversal, indicating that sellers pushed the price down, but buyers regained control. A Hanging Man suggests a potential bearish reversal, indicating that buyers are losing control.
- How to trade it: For a Hammer, consider going long after confirmation. For a Hanging Man, consider going short after confirmation.
3. Engulfing Pattern
- What it looks like: The Engulfing Pattern consists of two candles. The second candle’s body completely engulfs the first candle’s body. A bullish engulfing pattern occurs during a downtrend, while a bearish engulfing pattern occurs during an uptrend.
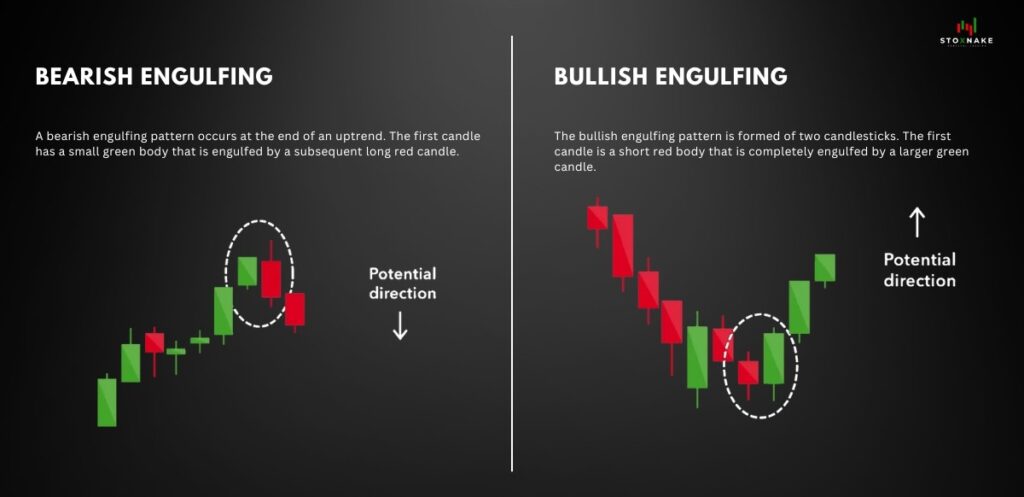
- What it means: A bullish engulfing pattern signals a potential reversal to the upside, while a bearish engulfing pattern signals a potential reversal to the downside.
- How to trade it: Enter a trade in the direction of the engulfing candle after confirmation.
4. Morning Star and Evening Star
- What it looks like: These are three-candle patterns. The Morning Star (bullish reversal) appears during a downtrend and consists of a long bearish candle, a small-bodied candle (Doji or spinning top), and a long bullish candle. The Evening Star (bearish reversal) is the opposite and appears during an uptrend.
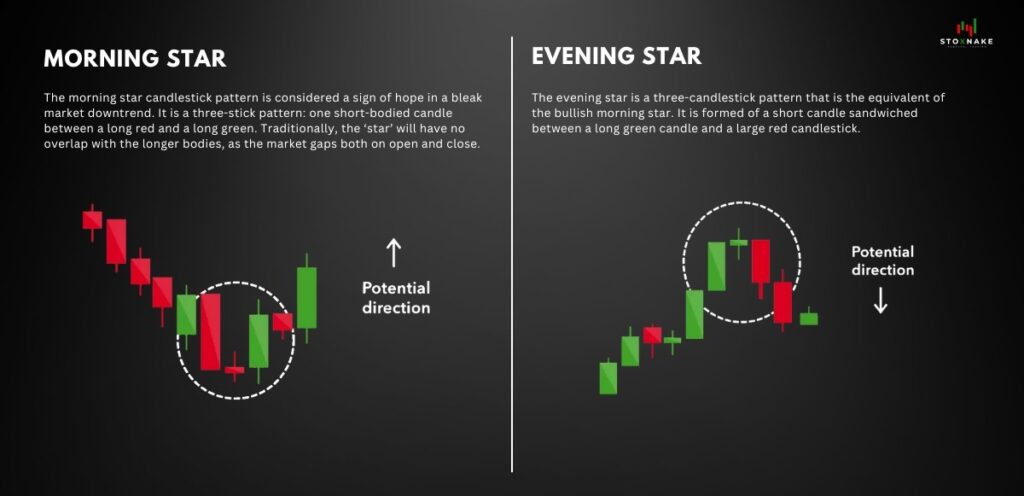
- What it means: The Morning Star signals a potential bullish reversal, while the Evening Star signals a potential bearish reversal.
- How to trade it: Enter a trade in the direction of the third candle after confirmation.
5. Shooting Star and Inverted Hammer
- What it looks like: Both patterns have a small body and a long upper wick. The Shooting Star appears during an uptrend, while the Inverted Hammer appears during a downtrend.
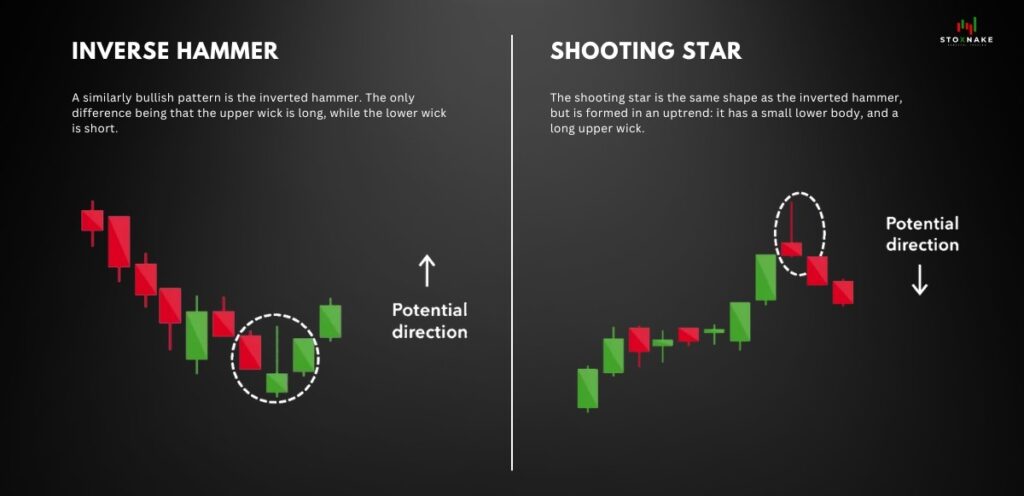
- What it means: A Shooting Star signals a potential bearish reversal, indicating that buyers pushed the price up but sellers regained control. An Inverted Hammer signals a potential bullish reversal, indicating that sellers pushed the price down but buyers regained control.
- How to trade it: For a Shooting Star, consider going short after confirmation. For an Inverted Hammer, consider going long after confirmation.
6. Piercing Line and Dark Cloud Cover
- What it looks like: The Piercing Line (bullish reversal) consists of a long bearish candle followed by a long bullish candle that closes above the midpoint of the first candle. The Dark Cloud Cover (bearish reversal) is the opposite.
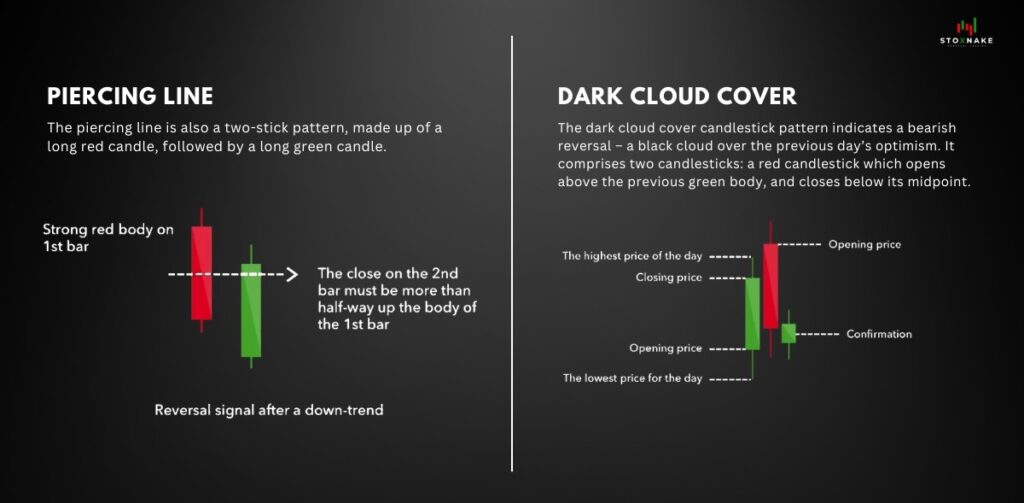
- What it means: The Piercing Line signals a potential bullish reversal, while the Dark Cloud Cover signals a potential bearish reversal.
- How to trade it: Enter a trade in the direction of the reversal after confirmation.
7. Three White Soldiers and Three Black Crows
- What it looks like: Three White Soldiers (bullish reversal) consist of three long bullish candles with small wicks. Three Black Crows (bearish reversal) consist of three long bearish candles with small wicks.
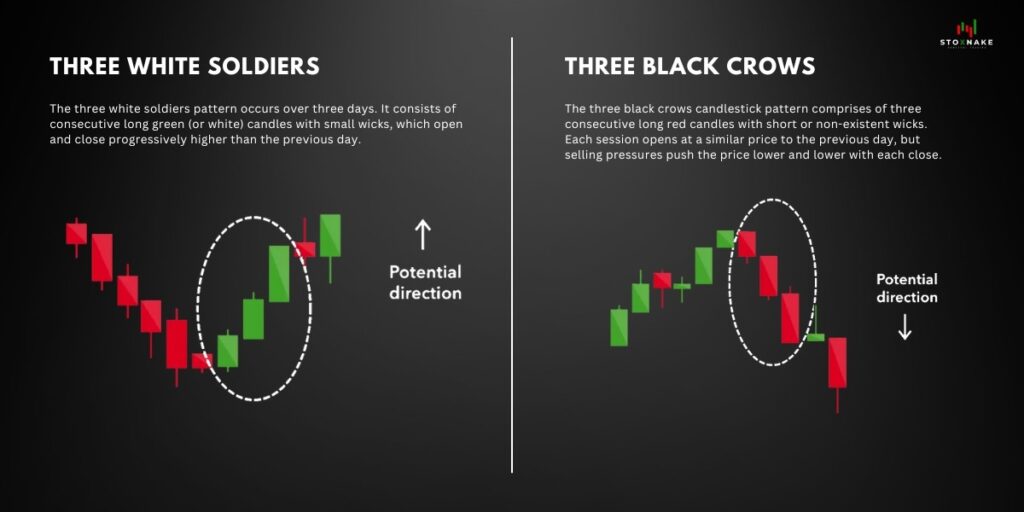
- What it means: Three White Soldiers signal strong buying pressure, while Three Black Crows signal strong selling pressure.
- How to trade it: Enter a trade in the direction of the trend after confirmation.
Tips for Trading Candlestick Patterns
- Wait for Confirmation: Always wait for the next candle to confirm the pattern before entering a trade.
- Combine with Other Indicators: Use candlestick patterns in conjunction with technical indicators like moving averages, RSI, or MACD for better accuracy.
- Consider the Context: Analyze the overall trend and market conditions before making a decision.
- Practice Risk Management: Use stop-loss orders and proper position sizing to minimize losses.
Also Read: Becoming a Professional Trader
Conclusion
Candlestick patterns are a timeless tool for understanding market psychology and predicting price movements. By mastering these top patterns, you can enhance your trading strategy and make more informed decisions. Remember, no pattern is 100% accurate, so always use proper risk management and combine candlestick analysis with other technical tools for the best results.


Pingback: Overcoming Self-Doubt in Trading: Trusting Your Analysis