The Ultimate Guide to Trading Charts: Importance, Types, and Choosing the Best One
When it comes to trading, charts are the trader’s best friend. They provide visual insights into market movements, making it easier to analyze trends, identify patterns, and make informed decisions. Whether you are a beginner or a seasoned professional, understanding the importance and variety of trading charts is crucial for your success.
Why Are Charts Important in Trading?
Charts are the backbone of technical analysis. Here’s why they are indispensable:
- Visual Representation of Data: Charts simplify complex price data into a graphical format, making it easier to understand market trends.
- Trend Analysis: They help traders identify whether the market is bullish, bearish, or ranging.
- Pattern Recognition: Patterns like head and shoulders, triangles, and double tops/bottoms can indicate potential price movements.
- Decision Making: Charts provide the information needed to make informed buy/sell decisions.
Types of Trading Charts
There are several types of trading charts, each with its unique characteristics and use cases:
Line Chart
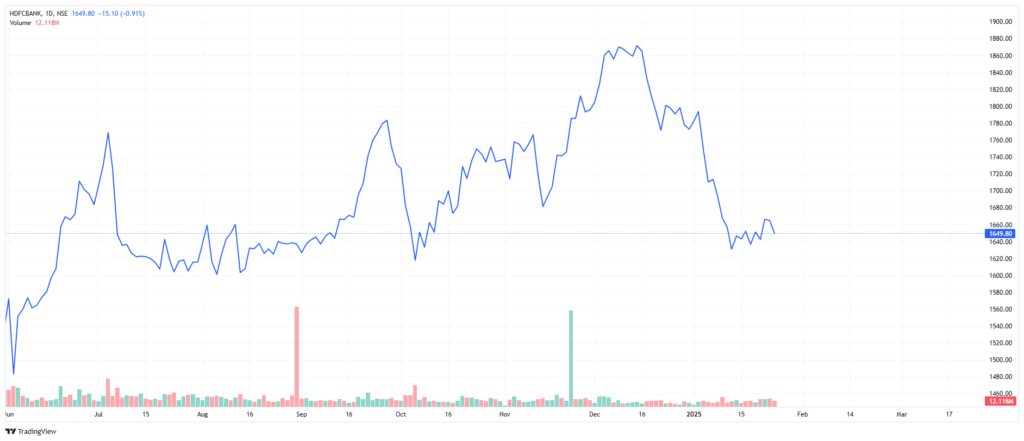
- Description: A simple chart that connects closing prices with a continuous line.
- Use Case: Ideal for beginners to understand the overall trend of a market.
- Pros: Easy to read and interpret.
- Cons: Lacks detailed information about intraday price movements.
Bar Chart
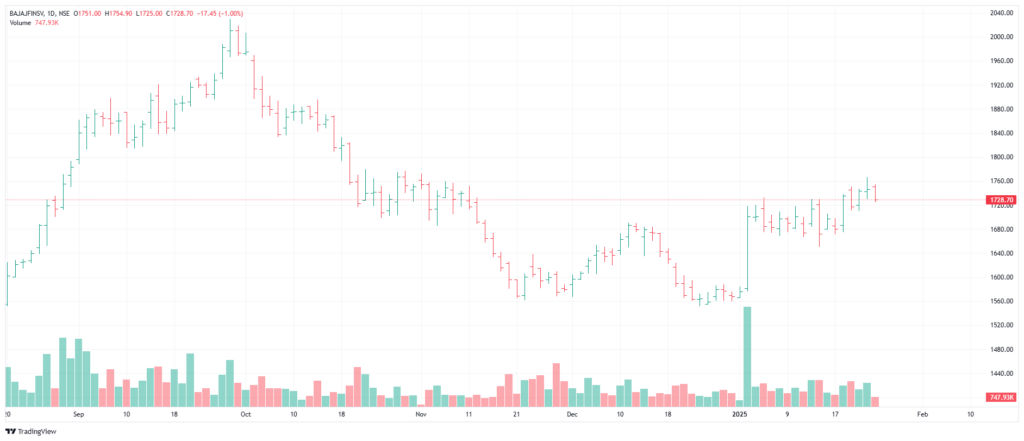
- Description: Displays the open, high, low, and close (OHLC) of a market for a given period.
- Use Case: Suitable for traders who want more detail than a line chart.
- Pros: Offers a clearer view of price volatility.
- Cons: Can be overwhelming for new traders.
Candlestick Chart
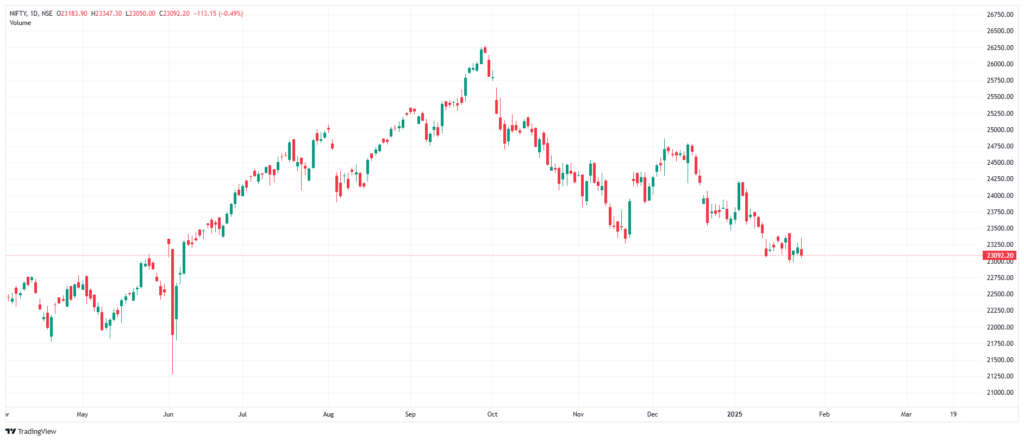
- Description: Similar to a bar chart but uses candle-like shapes to represent OHLC data.
- Use Case: Widely used due to its visual appeal and detailed information.
- Pros: Easy to identify patterns like doji, hammer, and engulfing.
- Cons: Can be confusing for complete beginners.
Heikin-Ashi Chart
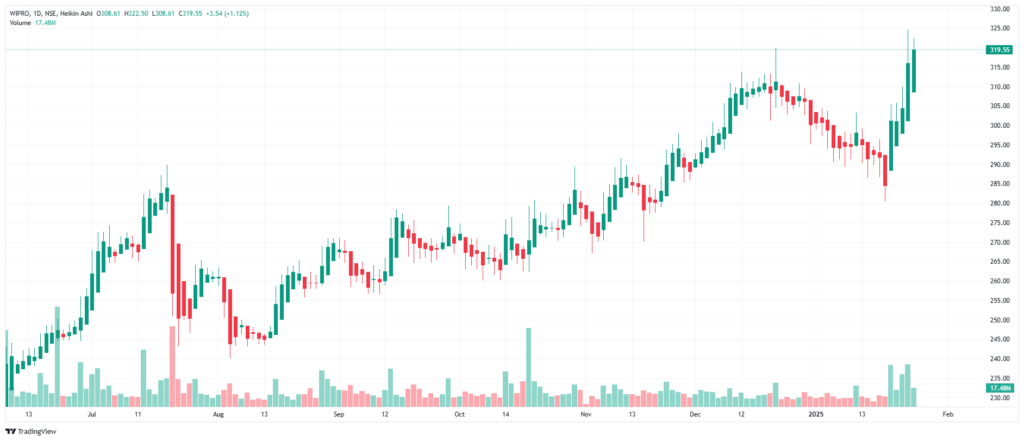
- Description: A smoothed version of a candlestick chart that filters out market noise.
- Use Case: Perfect for identifying trends and holding trades longer.
- Pros: Reduces false signals.
- Cons: Not suitable for precise entry/exit points.
Renko Chart
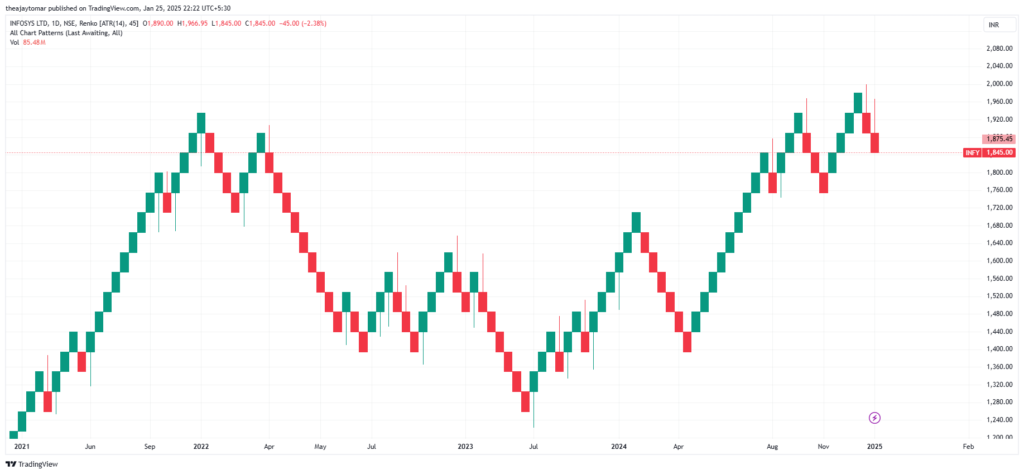
- Description: Focuses solely on price movement, ignoring time intervals.
- Use Case: Best for trend-following strategies.
- Pros: Filters out market noise effectively.
- Cons: Lags behind real-time price data.
Which Chart Is the Most Useful?
The “most useful” chart depends on your trading style and goals:
- For Beginners: Start with line charts to understand trends.
- For Intraday Traders: Candlestick charts are the go-to choice due to their detail and real-time pattern formation.
- For Swing/Position Traders: Heikin-Ashi charts provide a clearer picture of trends.
- For Trend Followers: Renko charts can help filter out noise and focus on price action.
Also Read : Why Most Retail Traders Struggle to Short Stocks or Cut Their Losses
Conclusion
The Ultimate Guide to Trading Charts: Trading charts are essential tools that every trader should master. While there are various types of charts available, candlestick charts are often the most versatile and widely used. However, the best chart for you will depend on your trading style, objectives, and comfort level.
Take the time to study and practice with different charts to find the one that aligns with your trading strategy. Remember, a well-understood chart is your ticket to making informed and confident trading decisions.


Pingback: Understanding Dow Theory : The Foundation of Technicals